


Archives
Air, Business, Freight News
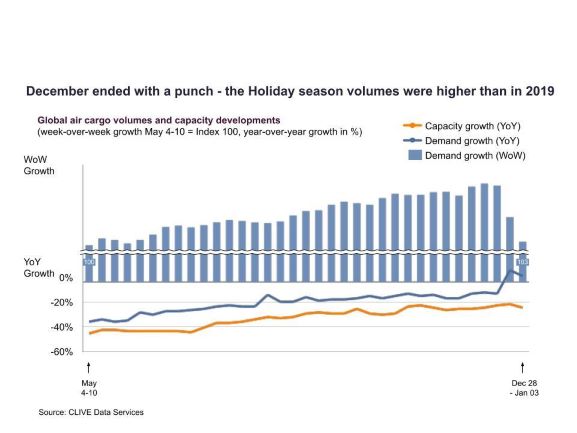
Global Air Cargo Volumes End 2020 on a “Relative High”
[ January 8, 2021 // Gary G Burrows ]Despite no traditional peak season for global air cargo demand in Q4 2020, the year ended on a ‘relative high’ in December with the first positive year-on-year growth in weekly volumes in over 12 months, according to the latest industry statistics from analysts CLIVE Data Services and TAC Index.
Volumes in the period 21 December 2020-3 January 2021 – compared to a corresponding period of 23 December 2019-5 January 2020 – rose 8%, contributing to two new records for CLIVE Data Services’ ‘dynamic loadfactor’ analyses. Based on both the volume and weight perspectives of cargo flown and capacity available, the loadfactor reached a new high of 73% in mid-December, while week ending 3 January 2021 saw an unprecedented level for this time of year of 65%, 13% points above the corresponding week a year ago.
December data showed a continued closing of the gap in year-on-year volumes to -5% versus December 2019 – from a yearly low of -37% in April – as volumes rose 2.5% over November 2020. This produced an overall dynamic loadfactor for the last four weeks of December of 71%.
CLIVE Data Services’ first-to-market weekly analyses also recorded a 2% increase in available capacity in December compared to November, but this remained -21% against the level of freighter and bellyhold cargo space on offer in the last month of 2019.
“For an industry looking for every glimmer of positivity, December’s data provided some modest growth indicators. December’s performance was surprisingly strong compared to the flattish level recorded in November and, in the second half of the month, volumes didn’t fall as much as we’d typically anticipate for this normally quieter time of year,” commented Niall van de Wouw, Managing Director of CLIVE Data Services. “To outside observers looking at 2020, increasing airline revenues, at a time of decreasing volumes, may seem a contradiction. But it is logical considering the rise in the dynamic loadfactor, where demand and supply come together. It clearly demonstrates the reason why airfreight rates have gone up and reemphasizes the value of weekly data. It allows companies to gain a better and quicker understanding of the way the market is trending and where it is rate-wise. In such a volatile business environment, this enables them to make better informed pricing decisions to support their recovery.”
Airfreight rates held up in December and, in some cases, increased over November even after the hoped-for peak season failed to materialize and there was no immediate sign of any major impact from shipments of Covid vaccine, said Robert Frei, Business Development Director at TAC Index.
Westbound pricing from Asia to Europe/US and Europe to the US was significantly higher compared to eastbound rates, as demonstrated by PVG-EU prices more than 4 times higher than FRA-CN, and FRA-US pricing more than 2.5 times higher than ORD-EU. “Pricing from Asia to the US is still the highest, followed by Asia to Europe and, lastly, the Transatlantic, with the highest prices reached in week 51,” he added.
Tags: CLIVE Data Services, TAC Index